Seascape Maps
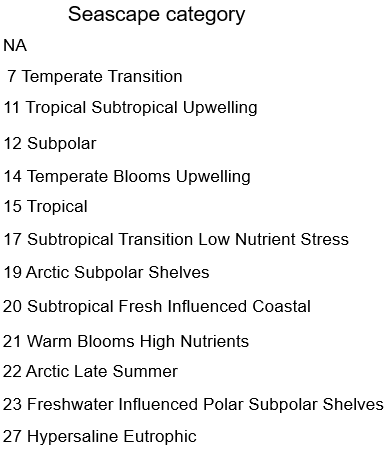
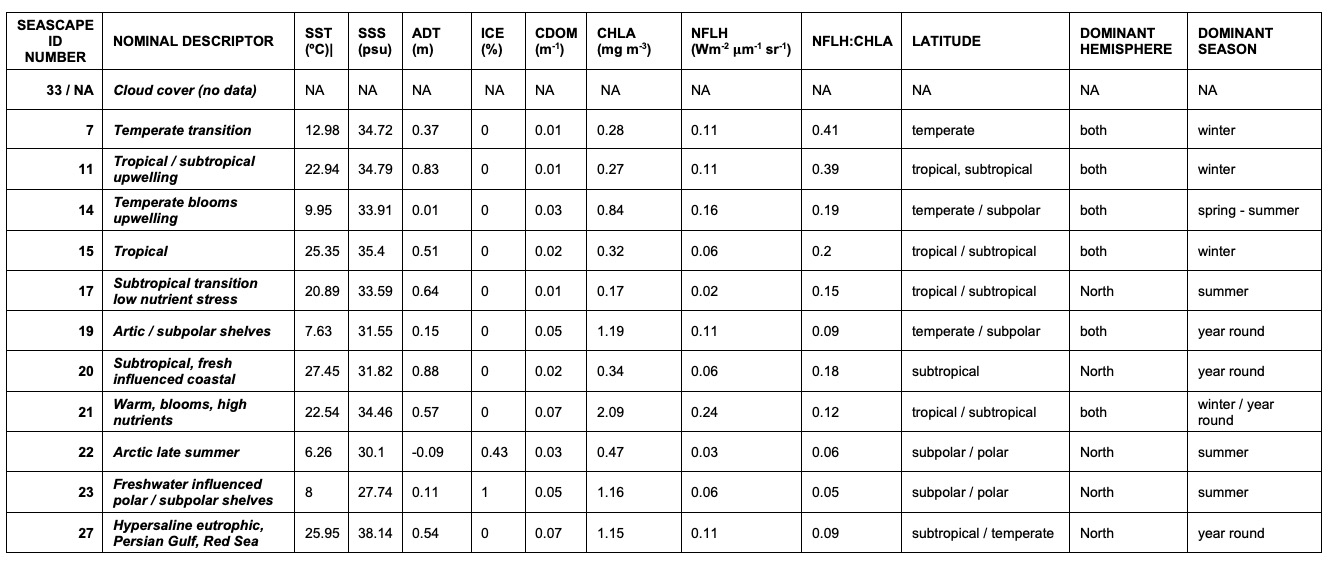
Seascapes represent coherent regions with unique biogeochemical function. Inputs to the model include SST, PAR, salinity, ice contribution, CDOM, Chl a, MODIS Normalized Fluorescence Line Height, nFLH:Chl a. Each raster is an 8-day composite. Pixels are 5km by 5km. Start and end dates of the dataset are 2002-08-29 to 2021-05-25.
Loading...
Time Series Plot of Seascapes in MPAs
Choose time range on the slider. Choose MPA from the drop down menu. Stacked plots show the percent cover of the seascapes in the selected MPA over the time period selected. Data is from 8-day composite Seascapes data product.
Comparative Time Series of Seascapes for MPAs
Plots are organized by bioregion (or all mpas) as well as either alphabetically or by descending latitude. Time series stacked plots show the percent cover of the seascapes in the MPAs. Summarized stack plots group the seascapes together over the entire time series. Data is from 8-day composite Seascapes data product.
Loading...
Maps of C-HARM Cellular Domoic Acid Probabilities
C-HARM model generates nowcast and forecasts of the probability of cellular domoic acid concentrations in excess of 10 picograms/cell in California and Southern Oregon coastal water. Each raster is a daily snapshot. Pixels are 3km by 3km. Start and end dates of the dataset are 2018-06-19 to 2022-03-17.
Loading...
Maps of C-HARM Particulate Domoic Acid Probabilities
C-HARM model generates nowcast and forecasts of the probability of particulate domoic acid concentrations in excess of 500 nanograms/L in California and Southern Oregon coastal water. Each raster is a daily snapshot. Pixels are 3km by 3km. Start and end dates of the dataset are 2018-06-19 to 2022-03-17.
Loading...
Maps of C-HARM Pseudo nitzschia Concentration Probabilities
C-HARM model generates nowcast and forecasts of the probability of Pseudo-nitzschia concentrations of in excess of 10,000 cells/L in California and Southern Oregon coastal water. Each raster is a daily snapshot. Pixels are 3km by 3km. Start and end dates of the dataset are 2018-06-19 to 2022-03-17.
Loading...
Summary Plots and Tables for C-HARM data in MPAs by Bioregion
Choose MPAs within Bioregions options for Hovmoller plots, Heatmap plots, and C-HARM parameters for summary tables. C-HARM cDA, pDA, and PN probabilities yearly summary stats table by MPA within bioregions. Number of days with data refers to the number of days per year that had data. Missing data is due to either (1) issues with ROMs, which is one of the parameters used in the algorithm for C-HARM outputs or (2) cloud cover. Number of days over the threshold refers to the number of days in a year, for the days that have data, which have at least one pixel (3km by 3km) over a 0.6 probability within the MPAs in a given bioregion (i.e. Northern, Central, Southern, Channel Islands)
Maps of EcoCast Projections for Vulnerable Species
The EcoCast Map product is a novel fishery sustainability tool that helps fishers and managers better evaluate how to allocate fishing effort to optimize the catch of target species (e.g. swordfish) while minimizing the accidental bycatch of blue sharks and protected species (leatherback sea turtles, California sea lions). The Relative Bycatch:Target Catch Probability Product is produced using a data-driven, multi-species predictive habitat modelling framework.Each raster is a daily snapshot. Pixels are 25km by 25km. Start and end dates of the dataset are 2018-05-09 to 2022-04-10.
Loading...
Time Series Anomaly Plots of C-HARM Particulate Domoic Acid and EcoCast
C-HARM probability of particulate domoic acid concentrations in excess of 500 nanograms/L > 0.6 and EcoCAST Relative Bycatch:Target Catch Probability Product < 0 threshold plots. Each raster is a daily snapshot. Pixels are 3km by 3km. Purple areas in the water show areas where both thresholds are met.
Loading...
Time Series Anomaly Plots of C-HARM Cellular Domoic Acid and EcoCast
C-HARM probability of cellular domoic acid concentrations in excess of 10 picograms/cell > 0.6 and EcoCAST Relative Bycatch:Target Catch Probability Product < 0 threshold plots. Each raster is a daily snapshot. Pixels are 3km by 3km. Purple areas in the water show areas where both thresholds are met.
Loading...
Time Series Anomaly Plots of C-HARM Psudonitzschia Concentrations and EcoCast
C-HARM probability of Psuedo nitzschia concentrations in excess of 10,000 cells/L > 0.6 and EcoCAST Relative Bycatch:Target Catch Probability Product < 0 threshold plots. Each raster is a daily snapshot. Pixels are 3km by 3km. Purple areas in the water show areas where both thresholds are met.
Loading...